The Rose Chart by Dee McElligott
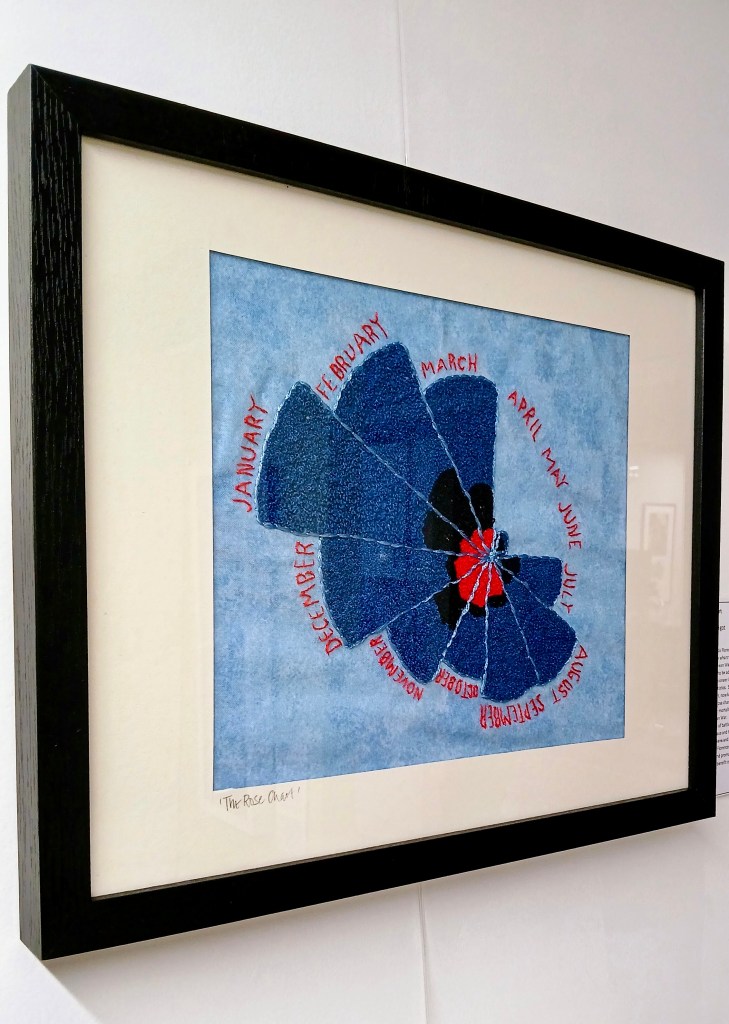
In most people’s minds Florence Nightingale is the lady of the lamp, the woman who transformed nursing through her work during the Crimean War. It is less well known that she was the first female to be admitted to the Royal Statistical Society. She was a pioneer in the visual presentation of information and statistics. She is credited with developing a form of the pie chart, now known as the polar area diagram but previously the rose chart. This is a representation of her chart analysing mortality in one 12 month period (1854-1855) in the Crimean War.
Red – direct cause of battle
Black – other disease and trauma
Blue – lack of hygiene and adequate sanitation
Following the war, Florence Nightingale devoted much of her time to campaigning for and promoting the improvement of sanitation for the benefit of public health.
